
Here’s an overview of F-1 visa issuances in Vietnam for the past 24 years in graph and numerical format. The gradual and then rapid growth in the number of student visas issued to young Vietnamese is a partial reflection of the expansion of Vietnam’s economy and family ability to pay. In the early days, many Vietnamese students studied overseas on various scholarships. (Note: The US government fiscal year begins on 1 October and ends on 30 September.)
FY1997: 1,153
FY1998: 1,193
FY1999: 886
FY2000: 930
FY2001: 1076
FY2002: 1523
FY2003: 1390
FY2004: 1827
You’ll notice that the take-off phase begins in 2005. Coincidentally, I relocated to Vietnam in early FY2006.
FY2005: 2404
FY2006: 3718
FY2007: 6152
FY2008: 9216
The dip in FY009 may have been due to the effects of the global financial crisis of 2007-08. The uptick resumed a year later and continued until FY2015
FY2009: 7633
FY2010: 8681
FY2011: 9456
FY2012: 10343
FY2013: 10867
FY2014: 14674
FY2015: 17674
The decrease from FY2015 to FY2016 of 11.28% could have been the result of a higher refusal rate. The upward trend continued a year later until the arrival of the COVID-19 pandemic when the bottom fell out.
FY2016: 15680
FY2017: 17032
FY2018: 16061
FY2019: 16586
FY2020: 5716
FY2021: 6707
F-1 issuances for FY2022 are on track to surpass the previous year’s number. As of June 2022, the second month of the four-month student visa “high season,” both posts, Hanoi and HCMC, had issued 6,604 student visas. Below are the stats, obtained from the Monthly Nonimmigrant Visa Issuance Statistics website.
October 2021: 178 (HCMC); 60 (Hanoi)
November 2021: 388 (HCMC); 121 (Hanoi)
December 2021: 249 (HCMC); 231 (Hanoi
January 2022: 168 (HCMC); 87 (Hanoi)
February 2022: 87 (HCMC); 28 (Hanoi)
March 2022: 115 (HCMC); 47 (Hanoi
April 2022: 132 (HCMC); 98 (Hanoi)
May 2022: 362 (HCMC) 409 (Hanoi)
June 2022: 2432 (HCMC); 1412 (Hanoi)
The recovery is in full swing and is likely to continue in FY2023. As of May 2022, there were 23,809 Vietnamese students at all levels, mostly in higher education.
Here are worldwide F-1 stats from 2017-2021.
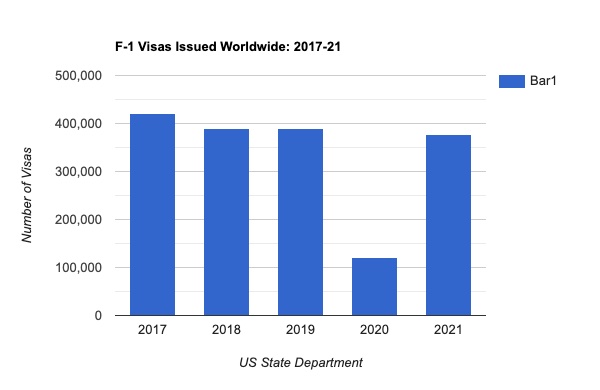
2017: 421,008
2018: 389,579
2019: 388,839
2020:121,205
2021: 377,659
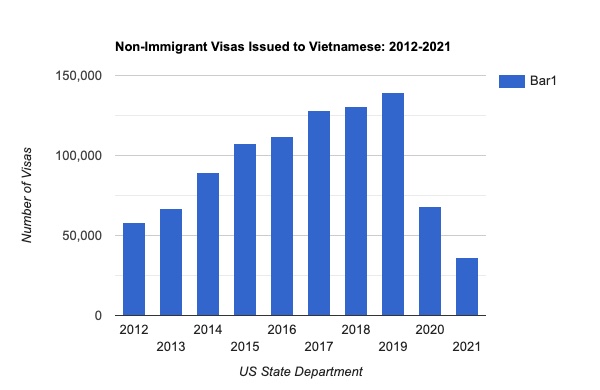
Finally, here’s bar graph of the non-immigrant (B1/2 business and tourist) visas issued to Vietnamese from 2012 to 2021. You’ll notice the steady increase until the arrival of the COVID-19 pandemic in early 2020.
And here are the adjusted refusal rates from 2021-2006 in descending chronological order. The denial rate went from 40.9% in 2006 to 11.32% last year.
2021: 11.32%
2020: 18.78%
2019: 23.70%
2018: 26.2%
2017: 24.06%
2016: 29.49%
2015: 23.43%
2014: 14.3%
2013: 20.3%
2012: 22.2%
2011: 33.5%
2010: 36.1%
2009: 42.3%
2008: 38.8%
2007: 36.3%
2006: 40.9%
The worldwide refusal rates for B1/B2 and F-1 (student) visas in 2021 were 16.8% and 19.84%, respectively.
Visa Category Issued Refused Total Applications
B1/B2 814,957 164,616 979,573 (16.8% refusal rate)
F1 357,839 88,583 446,422 (19.84% refusal rate)
Vietnam is in good company in terms of B visa denials. I’m trying to get information about F-1 denials but suspect the rate is much higher, based on anecdotal evidence.
In case you’re interested, here’s an official (US State Department) definition of adjusted refusal rate: How is the Visa Waiver Program Adjusted Visa Refusal Rate Calculated? The Visa Waiver Program nonimmigrant visitor visa refusal rate is based on the worldwide number of applicants for visitor (B) visas who are nationals of that country. B visas are issued for short term business or pleasure travel to the United States. For information about qualifying for a B visa for business or tourism, please see the Visitor Visa page. The Department identifies multiple applications from a unique applicant and omits all but the last action from the calculation. Thus, an applicant is counted only once each year and is assigned the status in which he or she ended the year. For example, if an applicant who was refused in April re-applies and is issued in July, he or she will count only as an issuance. Similarly, if an applicant who was refused in April re-applies and is refused again in July, he or she will be counted as only one refusal. Rarely, an applicant may end the year in a third category, “overcome.” This happens when an officer has the information he needs to overcome a refusal but has not processed the case to completion. The adjusted refusal rate equals: [Refusals minus Overcomes] divided by [Issuances plus Refusals minus Overcomes]. Example: Determination of B Visa Adjusted Refusal Rate for Country X: Country X, worldwide, had 305,024 B visa applicants end the fiscal year in the “issuance” status; 20,548 end in “refused” status; and 88 end in “overcome” status. Refusals minus Overcomes = 20,548 – 88 = 20,460 Issuances plus Refusals minus Overcomes = 305,024 + 20,548 – 88 = 325,484 20,460 divided by 325,484 = 6.3 percent (Adjusted Refusal Rate).
Shalom (שלום), MAA
